
Visitor sociology
As the Bpi does not keep files of those registered, it regularly carries out qualitative surveys to generate information about the profile, practices and representations of its users. Since 2003 in particular, every three years it carries out a barometric study with its audiences
See all the studies carried out by the Bpi on its professional website.
Also see the library in figures.
The library’s visitors
2024 Study
The last audience survey, conducted in March 2024, questioned 1,663 people.
View the full presentation (French only).
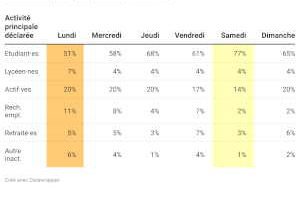
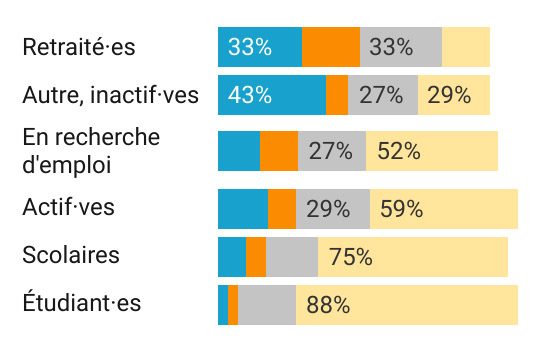
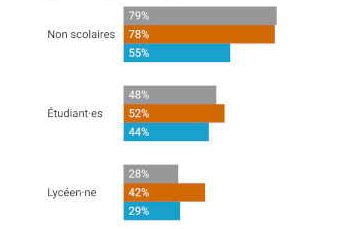
User profile
With this infographic, discover the profile of users coming to the library: their age, sex, activity…
Types of use
Visitor number surveys have enabled us to know what users do at the Bpi: examine documents, use a personal computer or not…